---
title: "Running Performance Analysis: Track Your Progress · Runima"
description: "Compare running performance across training blocks. Track speed, endurance and heart rate at a similar pace. See changes beyond your average pace."
canonical_url: "https://runima.fit/features/performance-analysis"
meta:
"og:description": "Compare running performance across training blocks. Track speed, endurance and heart rate at a similar pace. See changes beyond your average pace."
"og:image": "https://runima.fit/og-image.jpg"
"og:image:height": "630"
"og:image:type": image/jpeg
"og:image:width": "1200"
"og:title": "Running Performance Analysis: Track Your Progress"
"twitter:image": "https://runima.fit/og-image.jpg"
---
> Index of every page on this site: [llms.txt](https://runima.fit/llms.txt)
Running performance analysis
# Track changes in your running performance
Compare weeks of training, your best efforts and heart rate at similar paces. See what has changed, then decide what to work on next.
[**Start free**](https://runima.fit/signup) **See an example**
Free during early access · No credit card
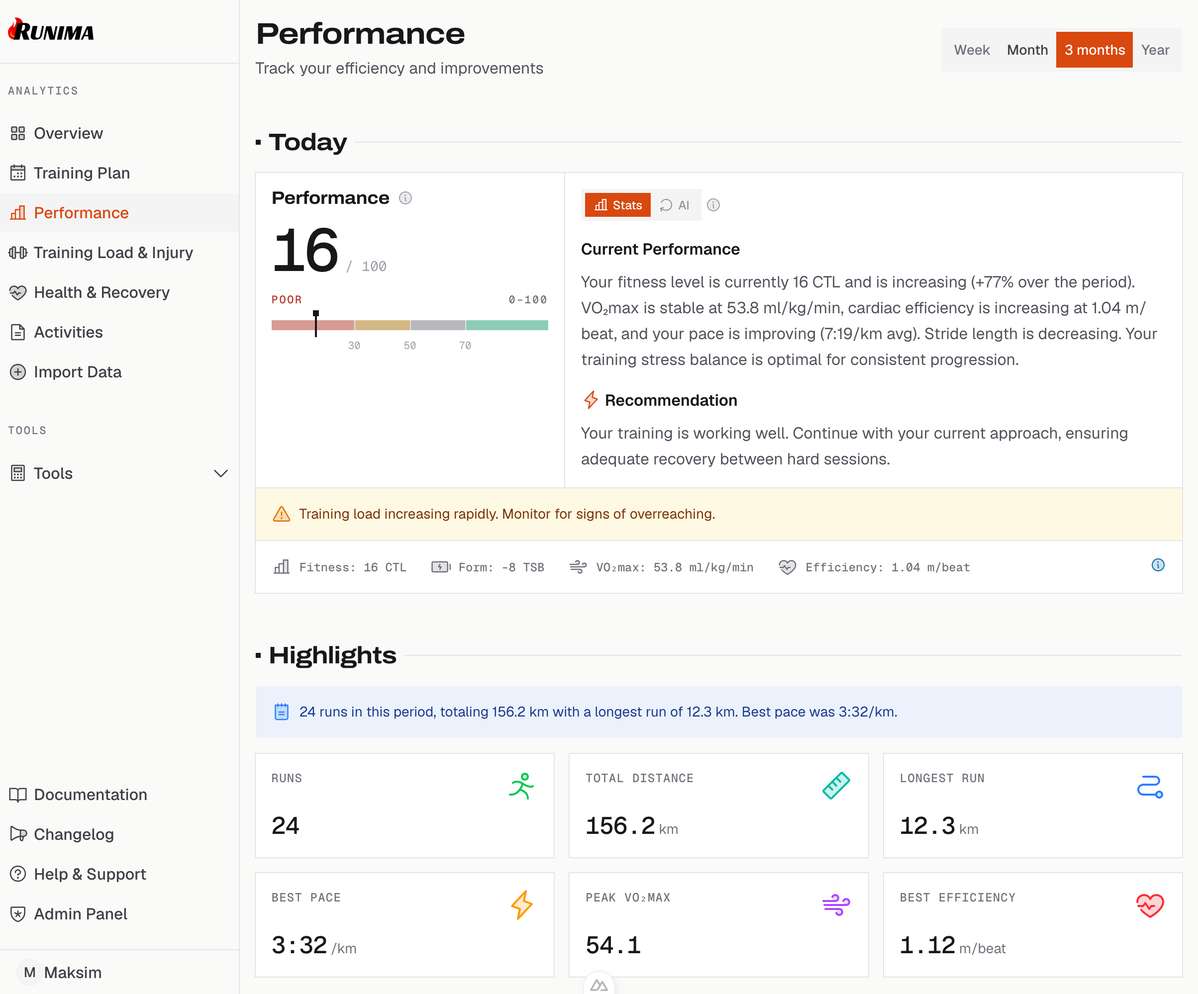
Example data · Not from real runners
## Compare your speed across distances
Compare your best recorded efforts with race estimates from one reference result. See which distances you have tested and where your results differ.
### Speed & Endurance
Race estimates from your best efforts
Reference distance
5K
45.8
Reference VDOT
3:20 3:40 4:00 4:20 4:40 5:00 5:20 5:40 400 m 800 m 1 mile 3K 5K 10K HM M
Best effort
Daniels equivalent
All-time best efforts, including training runs. Results may come from different stages of fitness. Race estimates start at one mile; shorter distances show recorded results only.
A missing or slower result may reflect an untested distance, not a weakness. All-time records are not a measure of progress within one training block. Estimates are not guaranteed race results.
Example data · Not from real runners
## Track distance per heartbeat
Cardiac efficiency shows how far you run per heartbeat. Each point is a run; the dashed line shows the trend over time.
### Cardiac efficiency
Distance per heartbeat
1.21m/beat
Sample average
1.11 1.14 1.17 1.20 1.23 1.26 1.29 1.32 Aug 3 Aug 10 Aug 17 Aug 24 Aug 31 Sep 5
A higher number does not always mean better fitness. Speed, hills, weather and sensor errors can change it. The calculation uses steady sections when available, or whole-run values otherwise.
Example data · Not from real runners
## Compare heart rate at a similar pace
Compare heart rate from steady runs at a similar pace, rather than mixing fast and slow runs. Each weekly point shows the middle heart-rate value, called the median.
### Heart Rate at Reference Pace
Comparable steady runs · recorded pace
5:30/km–6:00/km
Reference pace band
10
Qualifying runs
-6 bpm
Later vs earlier runs
bpm
144 145 146 147 148 149 150 Aug 3 Aug 8 Aug 13 Aug 18 Aug 23 Aug 28 Aug 31
This example includes 10 matching runs from 12 FIT files. You need at least 5 matching runs across 3 weeks. Heat, tiredness, hills and sensor errors can still affect the results. Hill adjustment needs enough recorded elevation data.
Example data · Not from real runners
## Compare more than an average
Compare two training periods side by side. See the middle values, the range of results and how much the periods overlap.
### Heart rate in two training periods
bpm
138.0 141.0 144.0 147.0 150.0 153.0 156.0 159.0 Earlier block Later block
- Earlier block
- 150.5bpm median · 12 runs
- Later block
- 145.5bpm median · 12 runs
The box covers the middle half of results. The line marks the middle value (median), and the ends show the lowest and highest values. Pace, workouts and weather can affect heart rate. A change alone does not prove better fitness or explain its cause.
## Understand how much your results changed
Explore more performance measures:
- Compare 2–4 periods using box plots, confidence intervals and effect sizes.
- See whether heart rate rises or pace drops later in long runs.
- Compare best efforts from short distances to marathon estimates.
- Adjust for hills when your imported data is detailed enough.
Confidence intervals show uncertainty in a model estimate. Effect sizes show how large a difference is compared with run-to-run variation. Both depend on the model's assumptions; neither proves what caused a change. Read your results alongside [**training load**](https://runima.fit/features/training-load) and recovery.
## Choose training paces from a recent race
Use the free [**training pace calculator**](https://runima.fit/tools/training-pace-calculator) to find paces for easy runs and harder workouts. Use the [**race time predictor**](https://runima.fit/tools/race-time-predictor) to estimate results at another distance. These are estimates, not guaranteed finish times, especially for longer races.
[**Why heart rate changes at the same pace**](https://runima.fit/blog/run-faster-lower-heart-rate).
## See what your running history can tell you
Import your running files to track changes, compare training and plan your next week. Check the recorded data behind each result. Runima supports training decisions, not medical diagnoses.
[**Create a free account**](https://runima.fit/signup) [**See import instructions**](https://runima.fit/docs/getting-started/connecting-your-watch)
```json
{"@context":"https://schema.org","@graph":[{"@id":"https://runima.fit/#website","@type":"WebSite","inLanguage":"en","name":"Runima","url":"https://runima.fit/","publisher":{"@id":"https://runima.fit/#identity"}},{"@id":"https://runima.fit/features/performance-analysis#webpage","@type":"WebPage","description":"Compare running performance across training blocks. Track speed, endurance and heart rate at a similar pace. See changes beyond your average pace.","name":"Running Performance Analysis: Track Your Progress","url":"https://runima.fit/features/performance-analysis","breadcrumb":{"@id":"https://runima.fit/features/performance-analysis#breadcrumb"},"isPartOf":{"@id":"https://runima.fit/#website"},"potentialAction":[{"@type":"ReadAction","target":["https://runima.fit/features/performance-analysis"]}],"primaryImageOfPage":{"@id":"https://runima.fit/#logo"}},{"@id":"https://runima.fit/#identity","@type":"Organization","description":"Understand your running training load, track performance and plan your next week. Import watch files and share training with your coach.","name":"Runima","url":"https://runima.fit/","logo":{"@id":"https://runima.fit/#logo"},"sameAs":["https://instagram.com/runima.fit","https://www.threads.net/@runima.fit"]},{"@id":"https://runima.fit/features/performance-analysis#breadcrumb","@type":"BreadcrumbList","itemListElement":[{"@type":"ListItem","name":"Home","item":"https://runima.fit","position":1},{"@type":"ListItem","name":"Running Performance Analysis: Track Your Progress","position":2}]},{"@id":"https://runima.fit/#logo","@type":"ImageObject","caption":"Runima","contentUrl":"https://runima.fit/android-chrome-512x512.png","inLanguage":"en","url":"https://runima.fit/android-chrome-512x512.png"}]}
```
## Sitemap
See the full [sitemap](https://runima.fit/sitemap.md) for all pages.